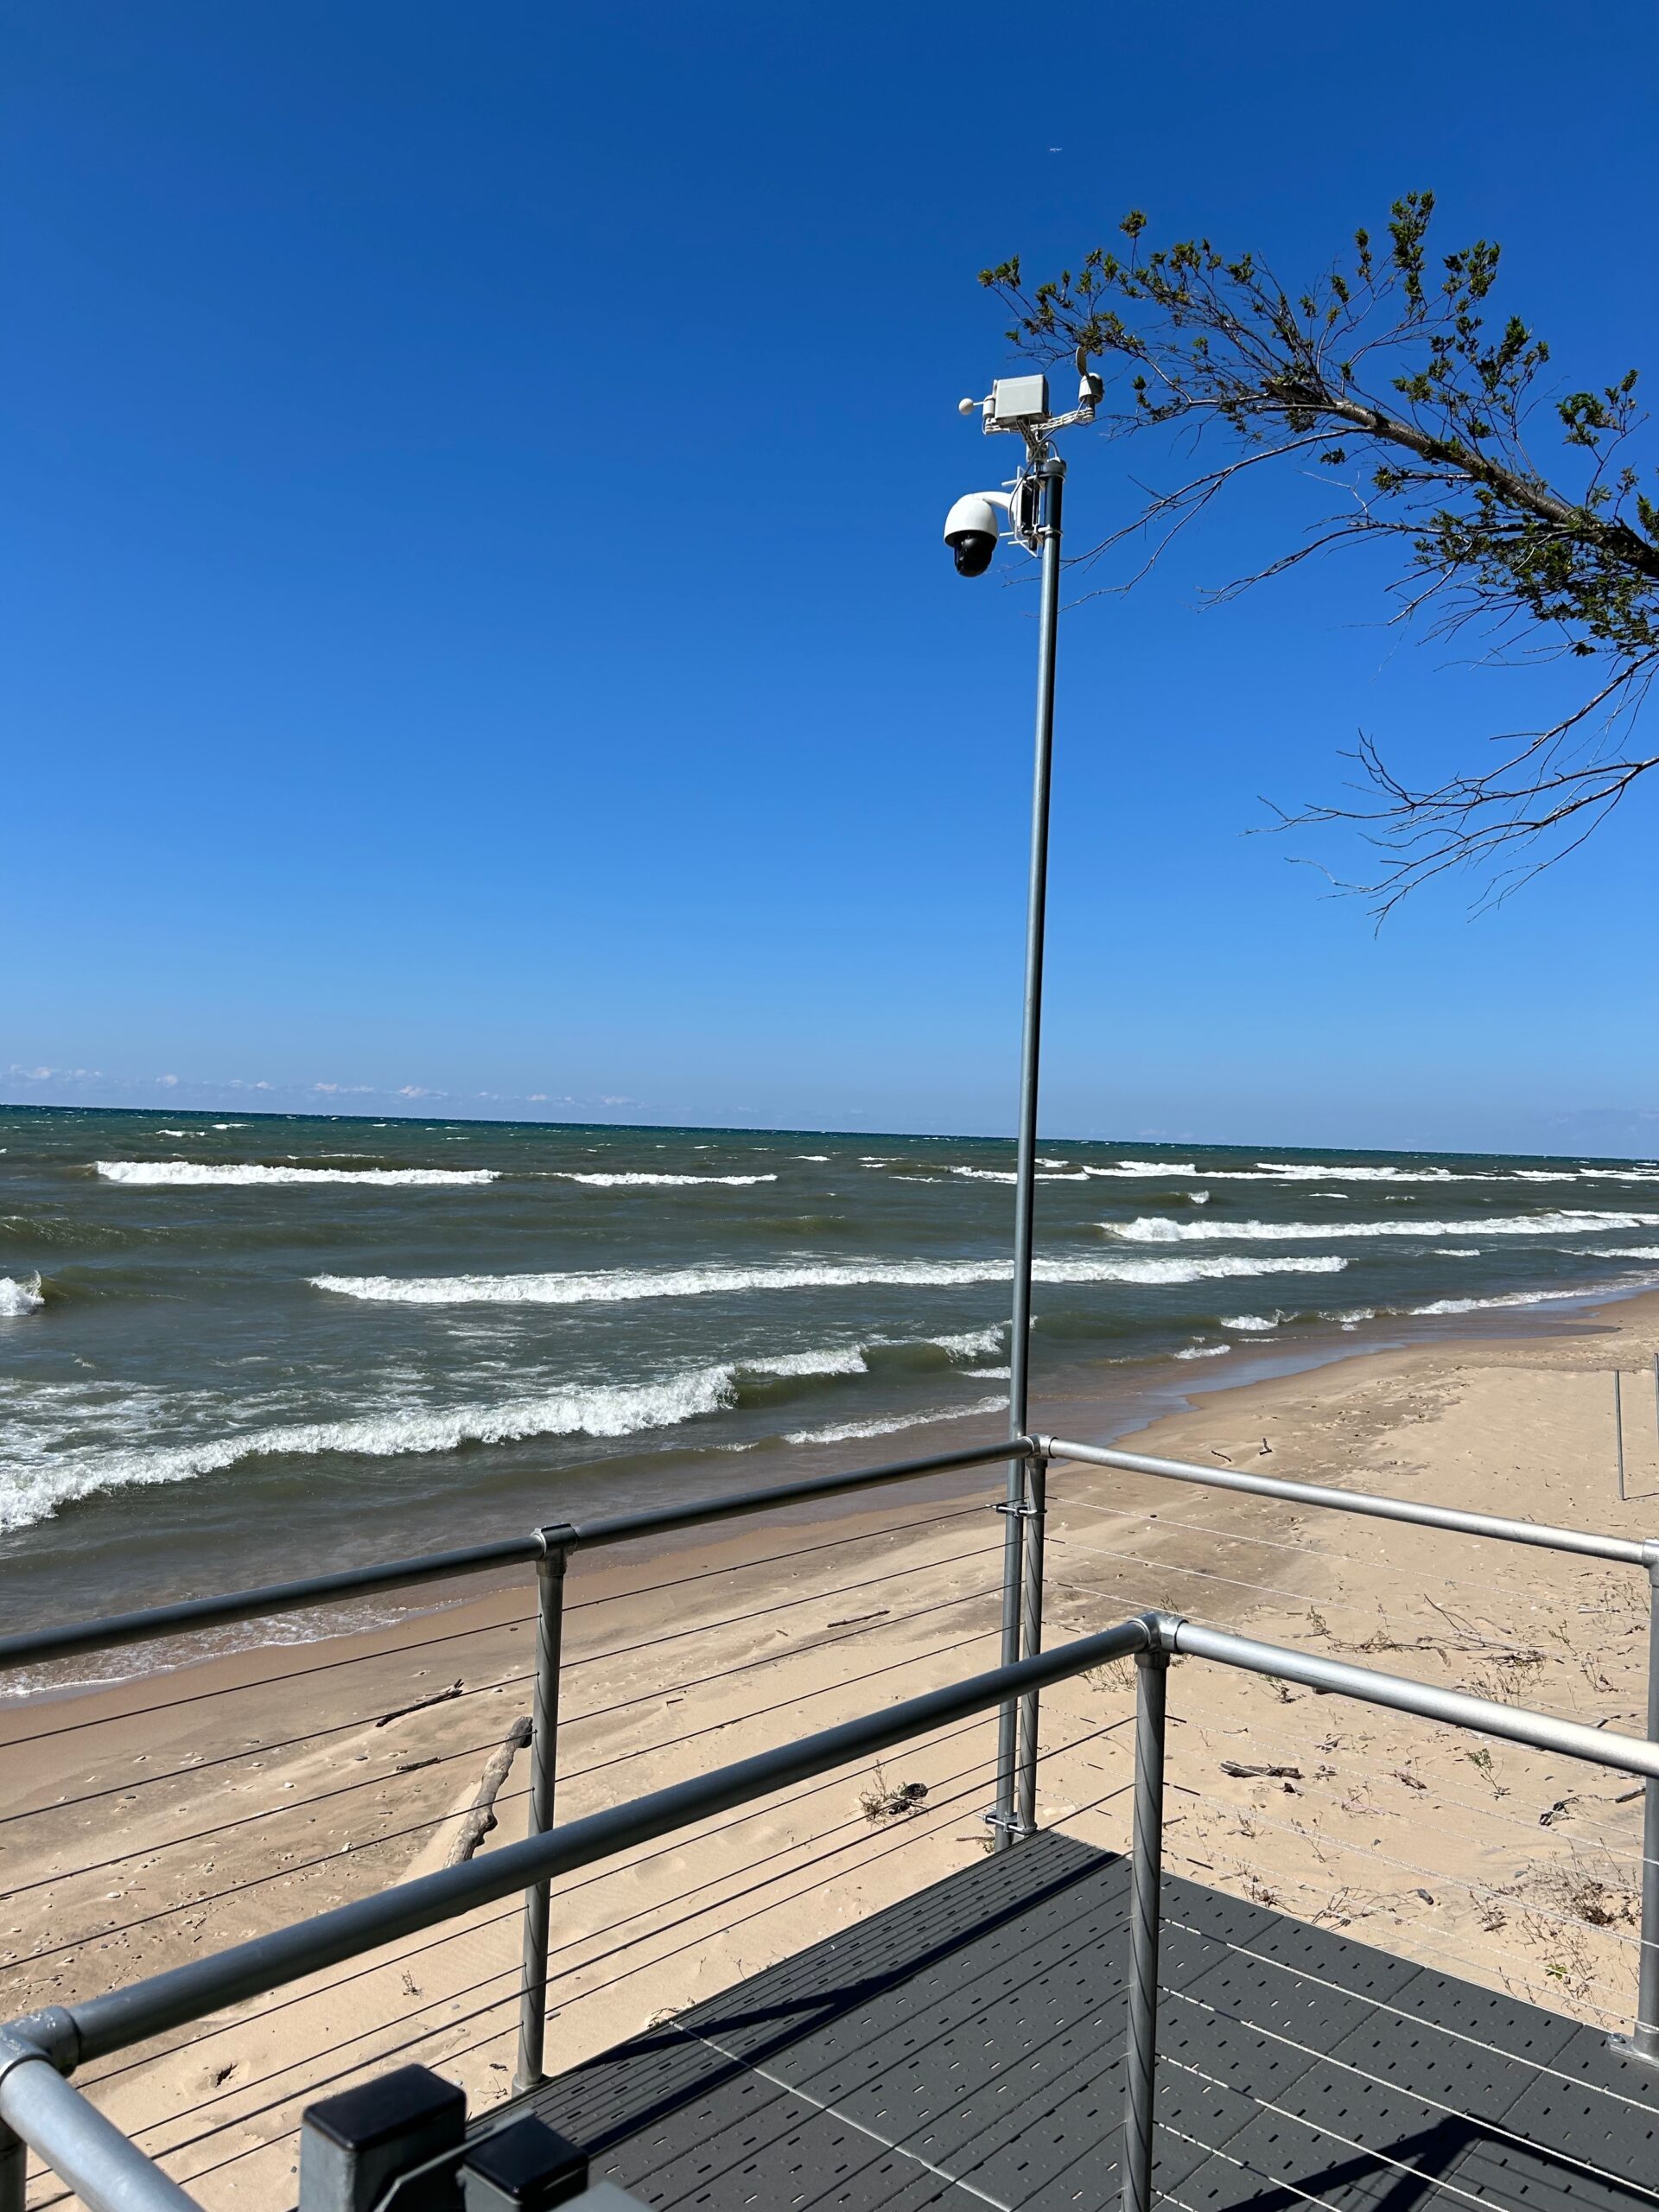
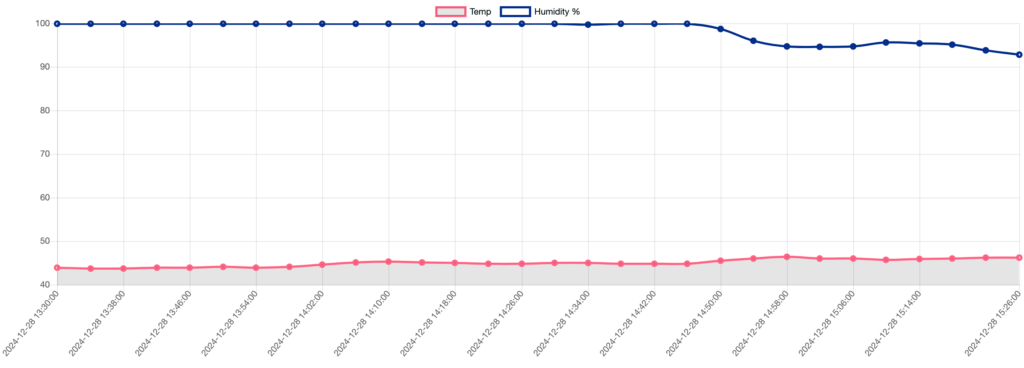
The newest feature uses the Chart.js library to produce a line chart for temperature and humidity trends. The data is read from the “bank thermometer,” a single-board computer that takes readings from an AM2302 digital temperature/humidity sensor. Every 2 minute, the tiny computer sends a brief blip of data – the temperature, humidity, and an identifier – to a script on the scootercam.net website, which timestamps the readings and saves them to the database.
Tip: You can hide/show humidity or temperature by clicking the heading at the top of the chart.
When you load the scootercam.net web page, the chart-js library queries the database and draws the graph.
Today -the day this was pulled together – we’re using all the data in the database and showing only every 12th record, so the detail isn’t overwhelming. At some point I’ll need to limit the data that’s charted – probably by 24 hour period – or give the user a means of selecting what time period to chart.